manifold-genetics
An end-to-end pipeline from PLINK genotypes to publication figures: PCA → admixture → manifold embedding → visualisation → metrics.
What it is for
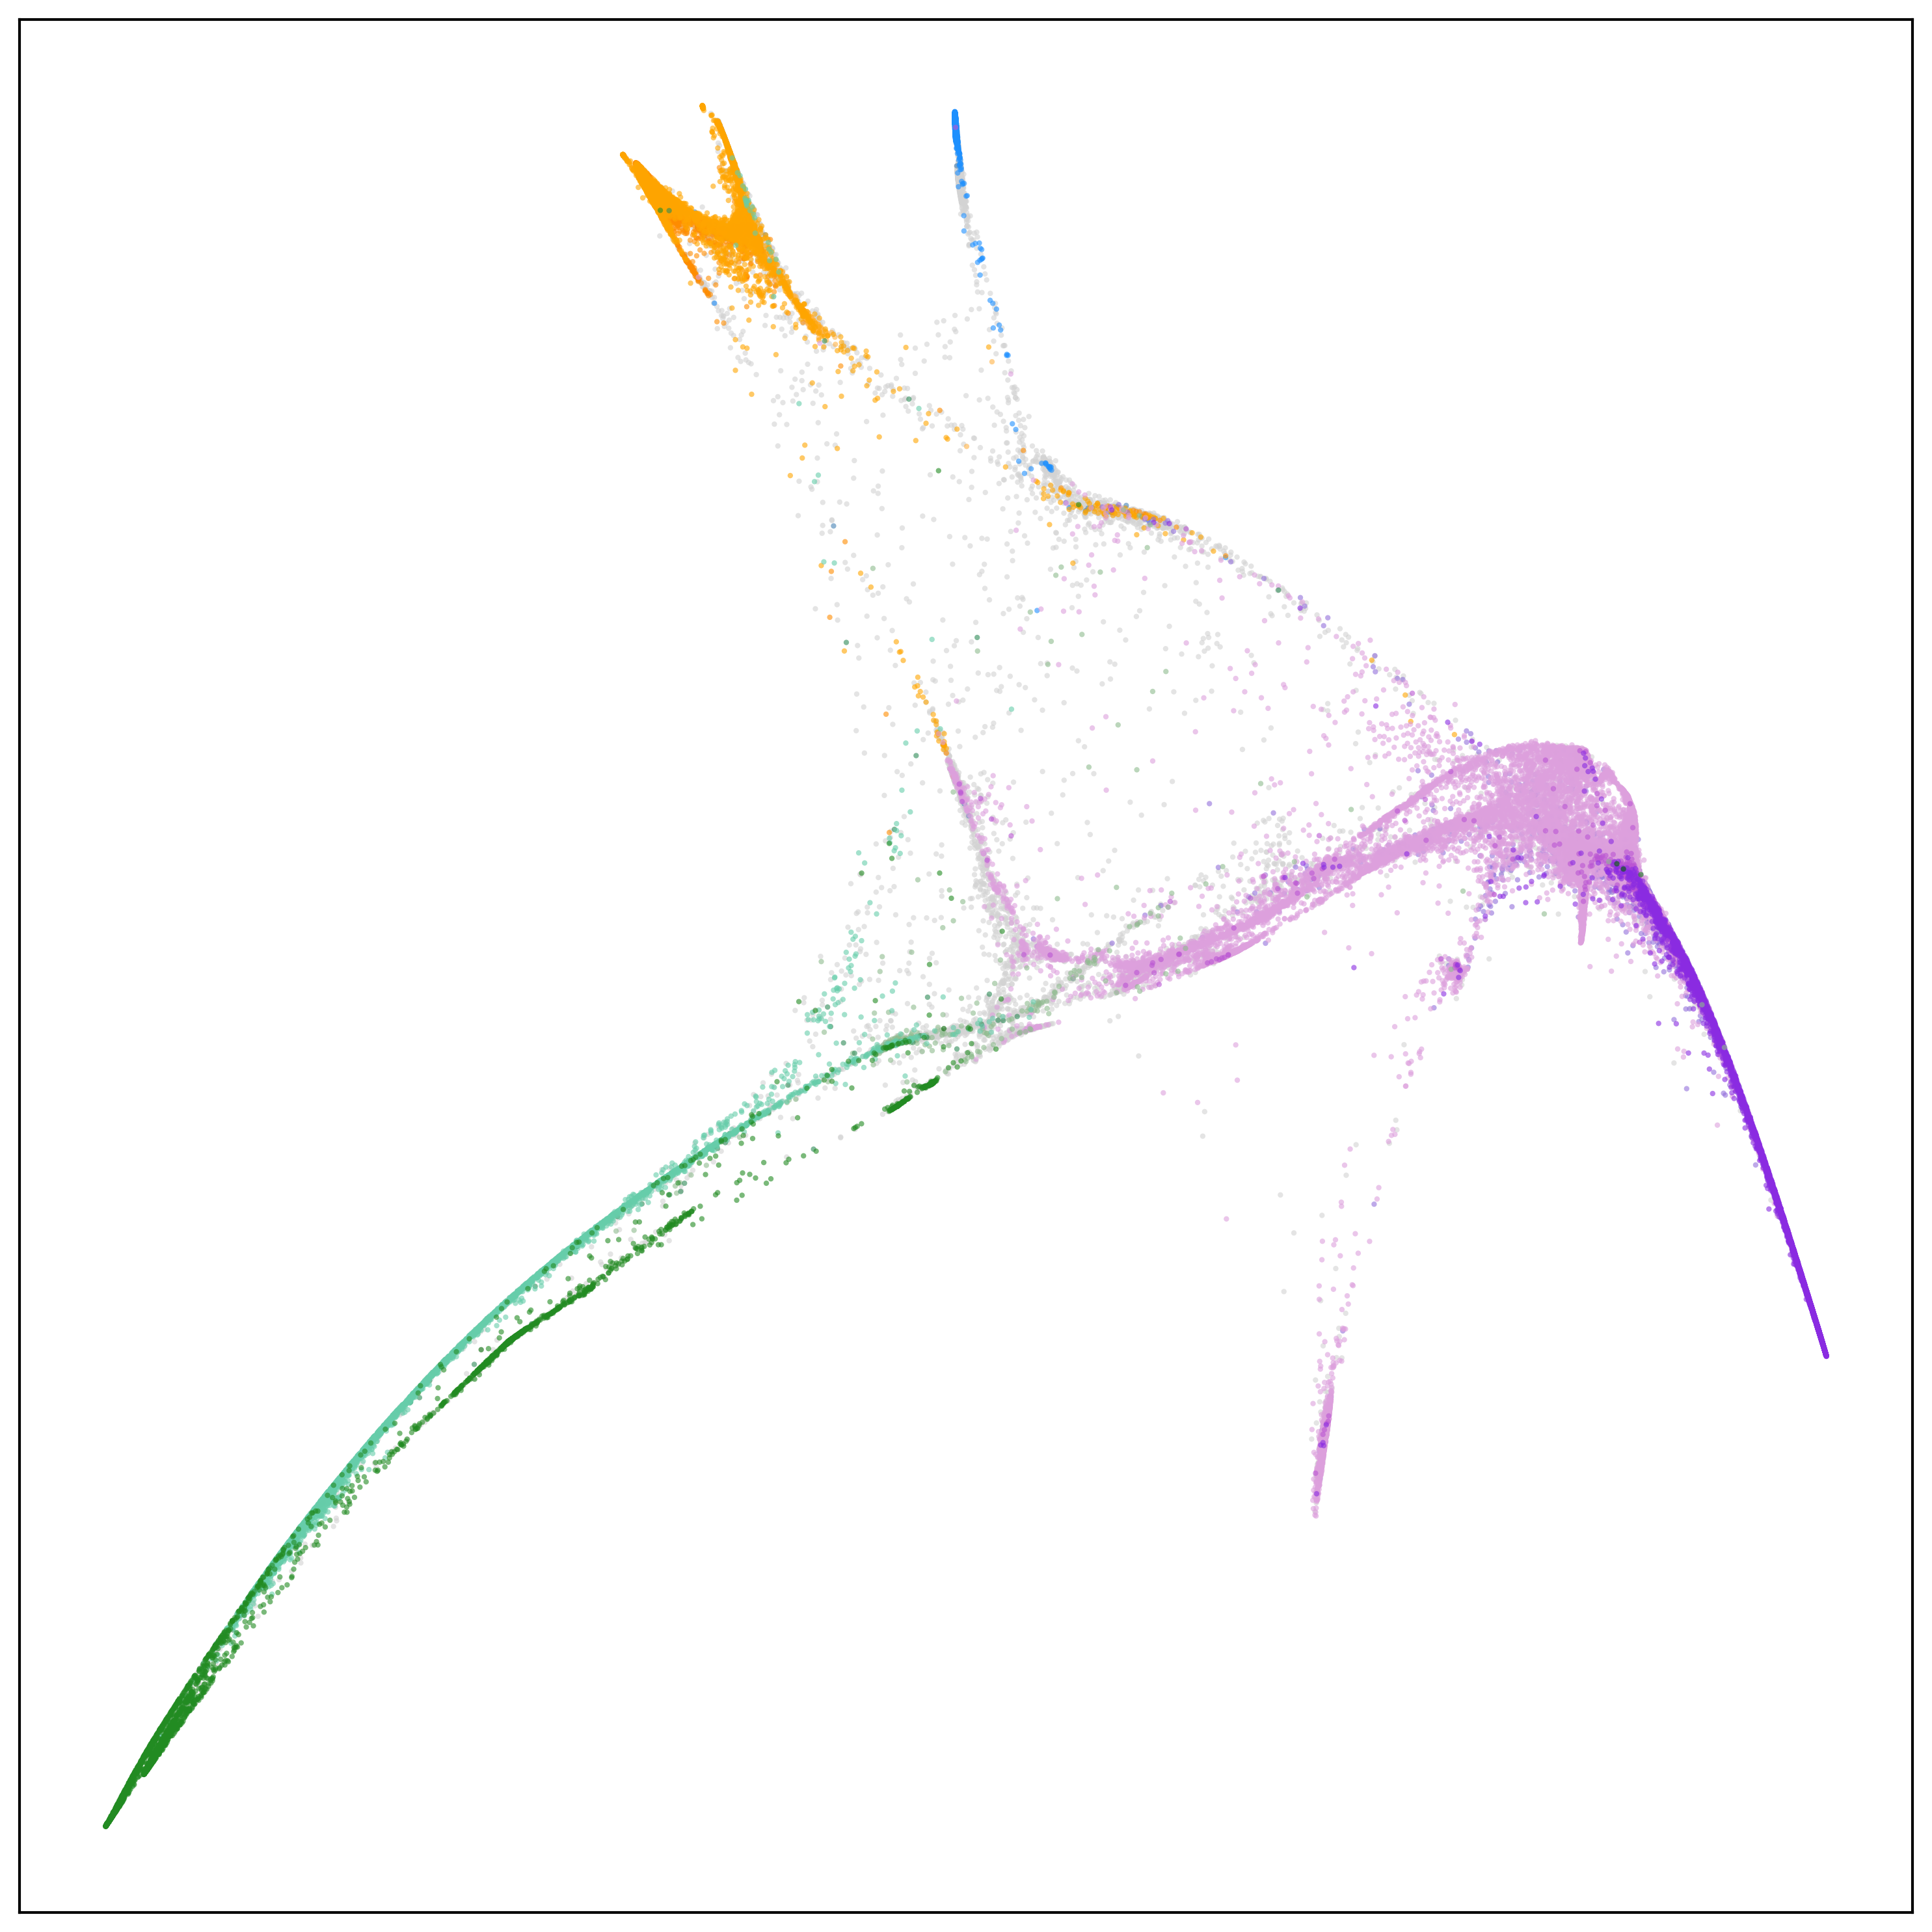
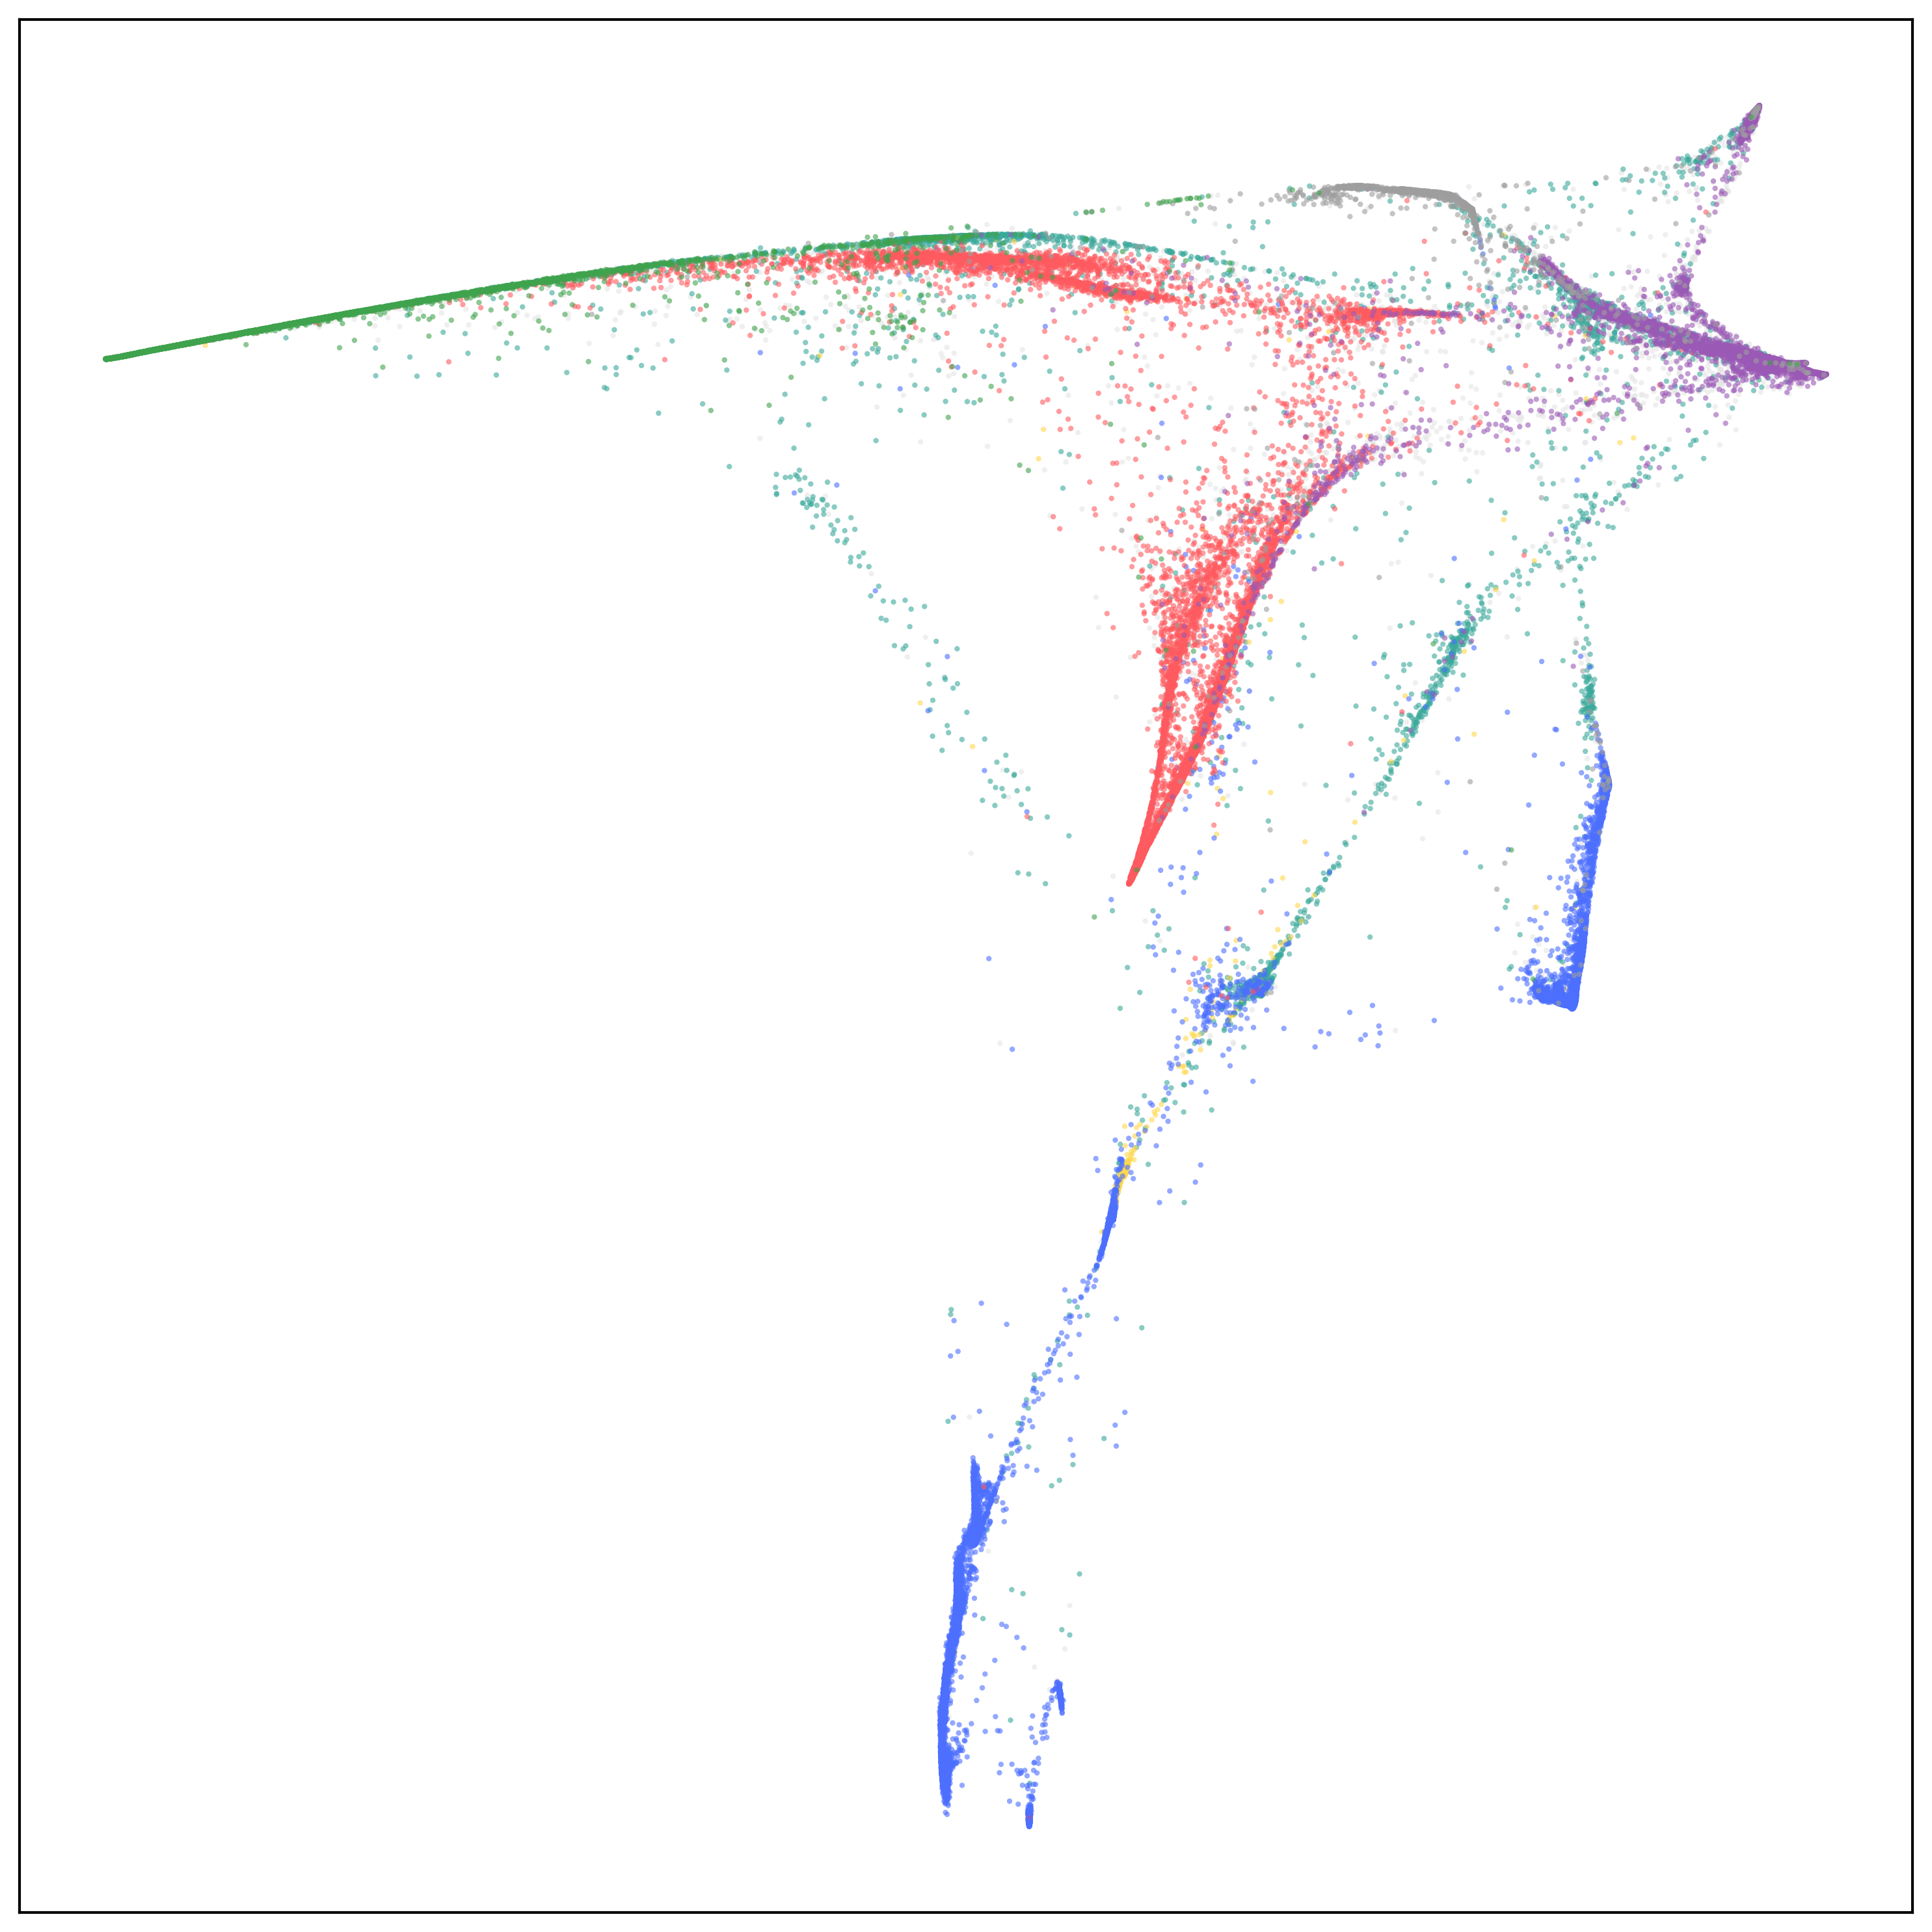
Human genetic variation is continuous, and our manifold learning framework implemented in this package can produce visualizations that recover that continuity. For more details see our upcoming publication. Below are PHATE embeddings for UK Biobank and All of Us cohorts.
This Package Returns the Following Things
| stage | what it produces |
|---|---|
| PCA | components, which are passed to the embedding method |
| Admixture | ancestry proportions per K, via neural-admixture |
| Embedding | 2-D coordinates from PHATE, UMAP, t-SNE or diffusion maps |
| Visualisation | scatter plots by any label column, admixture bar plots |
| Metrics | geographic and admixture preservation |
Every stage reads and writes the same kinds of files, so they compose: see formats for what each one expects, and the command line for running them individually.
Stages are checkpointed: a run that already produced PCA output reuses it. This matters on cohorts where PCA is the expensive part.
Inputs
Every run takes two genotype sets, in two roles:
- fit — the cohort used to estimate the model, including the PCA loadings and embedding.
- project — the cohort to which the fitted model is applied.
These sets may be identical, one may be a subset of the other, or they may come from entirely different cohorts. Their relationship determines the analysis, with each common arrangement represented by a preset:
| preset | fit | project | for |
|---|---|---|---|
projection |
a reference panel | your cohort | Visualizing your cohort along axes of genetic variation defined by a reference cohort |
subsample |
a subset of your cohort | that same subset | Cohorts that are too large—or too strongly dominated by one group—to embed in full, such as UK Biobank or All of Us |
whole_cohort |
a subset of your cohort | the whole cohort | Cohorts small enough to embed in full, such as the HGDP+1KGP example |
Where to start
- Install — pip or from source, the extras, and how to check it works
- Quickstart — the experiments as commands
- Tutorial — the same run narrated
- Formats — every file the pipeline reads and writes
- Command line — every subcommand
- Python API — driving it from a notebook
Citing
See the repository README.